Sharapova --> "meldonium concentration slightly above the permissible limit" https://t.co/J2MPsx8mZC via Google Translate— Roger Pielke Jr. (@RogerPielkeJr) April 27, 2016
Thursday, April 28, 2016
First Hints at Sharapova's Meldonium Concentration
Wednesday, April 27, 2016

Tuesday, April 26, 2016
Monday, April 25, 2016
Three Excellent Articles on the Current State of College Sports

Recently I have come across several really excellent articles on the current state of college sports.
First, John Gasaway (@JohnGasaway), who analyzes college basketball for ESPN, writes a thoughtful piece on why college sports are not facing an existential crisis, though the NCAA may be:
Far from being an “unstable situation,” college sports in general, college basketball more especially, and the NCAA tournament in particular instead present a series of successively smaller and progressively more advantageously situated concentric circles characterized by an unusual degree of hardiness solely as media properties. There are variables in play, naturally, and it’s not too much to term the threat of legal exposure “existential” — with regard to the NCAA. I don’t know who or what will be governing the sport in 2032, and I do trust that by then the players will have long since been receiving their fair share of the resulting revenues.Second, Andy Schwarz (@andyhre), a sports economist, takes a good hard look at the economic realities of college sports, and makes a similar case backed by ample data. He explains:
But if we view the essentials of the tournament as nothing more or less than 68 college teams playing 67 games of win-or-go-home basketball over three weeks from mid-March to early April, I’m yet to see anything even remotely persuasive in the way of a Book of Revelation. The essentials are eyeballs and basketballs, and if a tournament that earned record-setting revenues for a decade before, during and after the largest economic calamity since the Great Depression constitutes a bubble, well, put me down as bullish on this particular bubble.
Once or twice a year, as predictably as the launch of college football season or March Madness, we’re treated to the “everyone’s broke” meme in college sports. Sometimes it’s pegged to the football season. Sometimes we hear about it in the context of a new TV deal worth billions. And sometimes it’s tied to the release of new numbers, as was the case last week when USA Today released its trove of college sports accounting data as a resource for researchers everywhere. Along with the data they compiled, Erik Brady, Steve Berkowitz and Jodi Upton put out a companion piece addressing the familiar claim that college sports are reaching a crisis point where they will begin to crumble under their own cost. As economics professor Andrew Zimbalist says in the article, “It’s an unstable situation.” . . .Third, Dan Wetzel (@DanWetzel), of Yahoo Sports, looks at the dynamics underlying the flood of revenue that is coming to college sports and the political realities that result. He writes:
A sober reading of the history of these claims of unsustainable spending leads to a very different conclusion — specifically: NCAA expenses track with revenue and have done so for decades. But rather than hand-wringers learning from the past and ferreting out Occam’s ledger — the accounting isn’t telling the whole story — decade after decade we see similar fretting over schools losing money on college sports yet spending more and more, surely building to a “bubble” that has to burst. “This time it’s real” has been part of this sky-is-falling rhetoric for over a century.
On Tuesday, SportsBusinessDaily reported the Big Ten is close to agreeing to a six-year deal with Fox Sports for half its television rights. It would pay about $250 million per year, or $17.9 million per school. And that's just half the deal. CBS and ESPN will pay handsomely to split the rest.Read all three, in full. You'll be smarter for it.
This report comes a little over a week after the NCAA agreed to an eight-year, $8.8 billion extension with CBS and Turner to broadcast the men's basketball tournament. It brings the annual value of the event from $786 million to $1.1 billion, an increase of $314 million per year.
That's new money. That's found money. That's money that has yet to be used or allocated.
It's the same as the college football playoff generating about $470 million in revenue that didn't exist three years ago. Or conference-owned cable television channels hauling in hundreds of millions. The SEC Network, which launched in August 2014, doled out $455.8 million in fiscal 2015, $31.2 million per school. The New York Times predicted last year that Big Ten Network revenue would soon exceed $40 million per school, per year.
All of this money – namely all of this brand-new money that isn't even needed – ratchets up cries to share it with the student-athletes.
Tuesday, April 19, 2016
Science and the Upcoming Rehm Ruling
Here is the relevant IAAF rule in full (Rule 144.3 at p. 153 in the IAAF Rules):

In parallel the IAAF has created an internal Working Group to clarify Rule 144.3 which is "to bring clarity to what is a complex question of technical eligibility as soon as possible so athletes wishing to compete at the European Championships in Amsterdam and at Olympics in Rio are aware of eligibility." This Working Group is expected to report in June. It is unclear if the Group is to consider the just-commissioned study - they do state that they "will draw upon extensive knowledge from across disability and able-bodied athletics."
As we learned in the case of Oscar Pistorius, science does not always speak with one voice. In fact, the science of competitive advantage using prosthetics is like many other areas of science where a range of legitimate views are possible, based on valid assumptions and methods. Perhaps Rehm's case will be more clear cut than Pistoirus' case was - but maybe not. Rehm has already hinted at legal action if he is not allowed to jump in Rio.
Pistorius case was easier in an important respect because he was not a threat to medal in the Olympics. So his participation was framed as a feel-good story, not a story of epic achievement. Rehm is different. He threatens to medal if he is allowed to participate, and maybe even break the world record. That makes the decision to include or exclude him far more significant.
Sport turns to science to answer difficult questions with some risk, because science doesn't always have a single answer. This one may get interesting, stay tuned.
Monday, April 18, 2016
Lots of Items in the News Today

- Italian and French media collaborate on an investigation into motors in elite cycling. Really worth a look - Here is the 20 minute TV report (en Francais, but worth watching whatever languages you speak)
- The UCI responds
- USA Today has released an updated database on college athletics budgets
- Good NYT article on US swimmer Katie Ledecky's decision to swim in college and the financial rewards lost
- FIFA scandal: U.S. prosecutors examine role of banks, broadcasters and sponsors in soccer bribery probe
- Track and field: A cool viz of heights and weights of 2012 London participants
- CAS is filling in for Russia's suspended T&F federation to hold hearings on 12 athletes caught taking Meldonium. These athletes have waived their right to appeal. Problematic?
- South Africa's Caster Semenya scorched the track over the week-end, qualifying for Rio 2016 (watch her run here). Sean Ingle reviews the issues and previews the coming discussion. Here is me on "sex testing" in sport in the NYT last summer - a more in depth discussion will appear in The Edge.
- Close to home: Arsenal lost the PL title this year in London.
- The manufacturing of Mildronat (commercial name for Meldonium) wants it off the WADA prohibited list.
- Boris Becker doesn't think that Andy Murry should be talking about doping in tennis. Here is what Andy said to the Mail on Sunday.
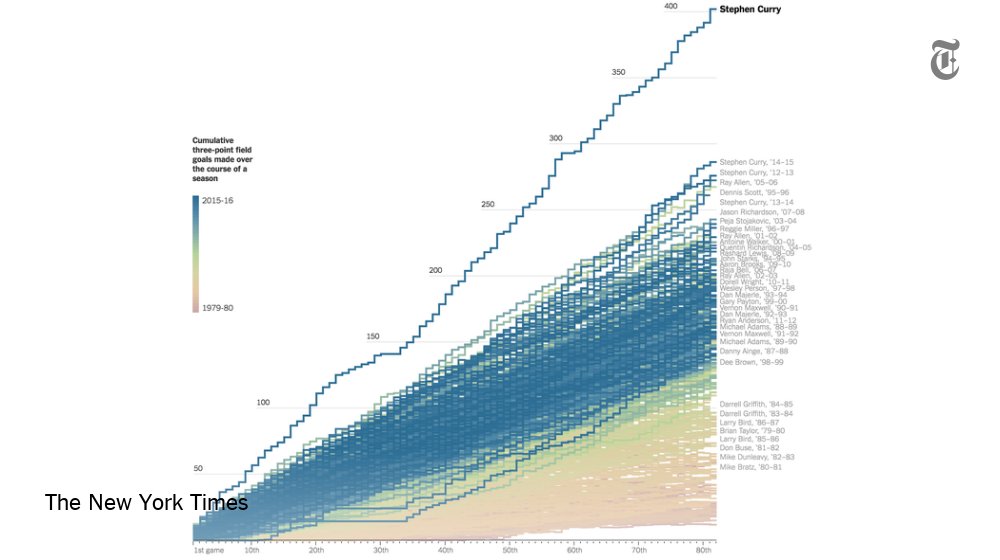
- Finally, the NYT's graphic showing Steph Curry's epic achievements from beyond the 3 point line this year is a masterful data viz:
Tuesday, April 12, 2016
University Transfers to Big Time Athletic Departments: Subsidy or Investment?

The table includes all schools with a reported subsidy (defined as the sum of student fees and institutional transfers) of less than 20% of the athletics department's revenues. There are 45 schools that make the cut. Of these, 9 have a reported subsidy of less than $1 million (which translates to less than 1% of total athletics revenues) and 16 others are less than 5%.
Almost all of these schools are part of the so-called Power 5 conferences where there is big time athletics and big time money.
If you want to redefine what The Chronicle calls a "subsidy" intro what might otherwise be called an "investment," then each of these schools show a return of at least 500% ($5 for every $1 invested) on funds invested into athletics. At the top end of schools that receive such "investments" the return is 500 to 1 (Michigan). In any department on campus such ROI numbers would cause administrators to smile.
A decision to call such funds "subsidies" or "investments" is probably based on how one views the overall worth of college athletes beyond just dollars and cents. Here are the numbers:
| institution | subsidy as % of athletics spending | external revenue | subsidy | |
| 156 | Oregon State University | 19.4% | $51,016,341 | $12,285,453 |
| 157 | University of Colorado Boulder | 19.0% | $52,017,285 | $12,209,473 |
| 158 | Washington State University | 18.6% | $44,322,180 | $10,104,638 |
| 159 | University of Utah | 17.5% | $46,608,204 | $9,862,106 |
| 160 | University of Virginia-Main Campus | 15.8% | $70,462,157 | $13,235,814 |
| 161 | Arizona State University-Tempe | 13.5% | $64,656,064 | $10,073,205 |
| 162 | Virginia Polytechnic Institute and State University | 11.1% | $64,954,358 | $8,110,828 |
| 163 | University of North Carolina at Chapel Hill | 10.8% | $74,693,320 | $9,078,593 |
| 164 | Georgia Institute of Technology-Main Campus | 10.4% | $61,361,761 | $7,107,777 |
| 165 | North Carolina State University at Raleigh | 9.5% | $63,792,160 | $6,708,651 |
| 166 | University of Louisville | 8.8% | $80,976,749 | $7,768,599 |
| 167 | University of Arizona | 7.9% | $92,009,900 | $7,901,134 |
| 168 | Florida State University | 7.6% | $96,794,108 | $7,980,366 |
| 169 | University of Minnesota-Twin Cities | 6.6% | $99,165,090 | $7,011,066 |
| 170 | Oklahoma State University-Main Campus | 6.4% | $110,281,827 | $7,521,475 |
| 171 | University of Wisconsin-Madison | 6.3% | $119,837,558 | $8,073,360 |
| 172 | Clemson University | 5.9% | $70,417,577 | $4,375,745 |
| 173 | University of South Carolina-Columbia | 5.7% | $92,987,503 | $5,631,976 |
| 174 | University of California-Berkeley | 5.5% | $85,279,969 | $4,982,173 |
| 175 | Texas Tech University | 5.3% | $72,636,657 | $4,086,756 |
| 176 | University of Mississippi | 5.1% | $71,962,577 | $3,886,423 |
| 177 | University of Illinois at Urbana-Champaign | 4.9% | $76,921,197 | $3,927,372 |
| 178 | Mississippi State University | 4.3% | $59,625,111 | $2,650,000 |
| 179 | The University of Alabama | 3.9% | $147,237,173 | $5,997,100 |
| 180 | Auburn University | 3.9% | $109,331,204 | $4,384,800 |
| 181 | Indiana University-Bloomington | 3.6% | $81,660,417 | $3,008,362 |
| 182 | University of Washington-Seattle Campus | 3.5% | $96,725,508 | $3,549,679 |
| 183 | University of Florida | 3.5% | $120,302,863 | $4,308,442 |
| 184 | University of Georgia | 3.2% | $100,220,875 | $3,274,712 |
| 185 | University of California-Los Angeles | 3.1% | $83,715,508 | $2,711,272 |
| 186 | Iowa State University | 2.9% | $66,212,985 | $1,957,396 |
| 187 | University of Kansas | 2.6% | $95,116,692 | $2,564,374 |
| 188 | University of Arkansas | 2.0% | $94,857,567 | $1,936,405 |
| 189 | University of Missouri-Columbia | 1.8% | $82,203,587 | $1,515,000 |
| 190 | University of Oregon | 1.1% | $193,875,299 | $2,155,099 |
| 191 | Michigan State University | 1.0% | $103,582,498 | $1,094,958 |
| 192 | Texas A & M University-College Station | 1.0% | $118,234,414 | $1,241,457 |
| 193 | University of Kentucky | 0.9% | $95,823,941 | $861,548 |
| 194 | University of Iowa | 0.6% | $105,275,037 | $683,917 |
| 195 | University of Michigan-Ann Arbor | 0.2% | $157,643,504 | $256,316 |
| 196 | Louisiana State University and Agricultural & Mechanical College | 0.0% | $133,679,256 | $0 |
| 196 | Ohio State University-Main Campus | 0.0% | $145,232,681 | $0 |
| 196 | Purdue University-Main Campus | 0.0% | $71,372,206 | $0 |
| 196 | University of Nebraska-Lincoln | 0.0% | $94,797,692 | $0 |
| 196 | University of Oklahoma-Norman Campus | 0.0% | $129,226,692 | $0 |
| 196 | The University of Texas at Austin | 0.0% | $161,035,182 | $0 |
Monday, April 11, 2016

Thursday, April 7, 2016
Which NCAA D1 Schools Have the Highest Reported Subsidies?

| institution | subsidy as % of athletics spending | external revenue | subsidy | |
| 1 | New Jersey Institute of Technology | 90.6% | $1,237,517 | $11,899,220 |
| 2 | University of California-Riverside | 89.0% | $1,696,085 | $13,788,851 |
| 3 | Central Connecticut State University | 88.0% | $1,771,635 | $12,959,383 |
| 4 | Indiana University-Purdue University-Indianapolis | 87.8% | $994,818 | $7,184,587 |
| 5 | Morehead State University | 86.2% | $1,491,916 | $9,341,671 |
| 6 | The University of Texas at Arlington | 86.2% | $1,628,784 | $10,152,846 |
| 7 | Longwood University | 86.1% | $1,358,361 | $8,416,143 |
| 8 | Winthrop University | 85.9% | $1,773,621 | $10,775,669 |
| 9 | Utah Valley University | 85.8% | $1,590,150 | $9,601,419 |
| 10 | Radford University | 85.8% | $1,863,266 | $11,237,598 |
| 11 | Stephen F Austin State University | 85.1% | $2,332,368 | $13,364,737 |
| 12 | Kennesaw State University | 85.1% | $2,608,908 | $14,907,125 |
| 13 | University of Maryland Eastern Shore | 84.8% | $846,088 | $4,708,513 |
| 14 | Stony Brook University | 84.7% | $4,206,726 | $23,298,044 |
| 15 | Northern Kentucky University | 84.6% | $1,837,533 | $10,113,985 |
| 16 | Cleveland State University | 84.1% | $1,818,928 | $9,627,983 |
| 17 | Alcorn State University | 84.1% | $1,010,423 | $5,329,700 |
| 18 | University of Missouri-Kansas City | 83.6% | $1,875,601 | $9,592,075 |
| 19 | Morgan State University | 83.6% | $1,522,142 | $7,753,009 |
| 20 | Eastern Michigan University | 83.4% | $4,997,815 | $25,083,708 |
| 21 | East Tennessee State University | 82.3% | $3,017,680 | $14,071,113 |
| 22 | George Mason University | 81.9% | $3,807,345 | $17,207,352 |
| 23 | University of South Carolina-Upstate | 81.7% | $1,304,471 | $5,834,118 |
| 24 | James Madison University | 81.6% | $8,042,437 | $35,725,049 |
| 25 | Texas A & M University-Corpus Christi | 81.6% | $1,940,154 | $8,600,266 |
You'll note that all of of these schools are small, and are not what people traditionally think of when they think of big-time college athletics. Of the 201 schools, 130 receive more than a 50% subsidy, so it is common and the numbers are significant. The median subsidy of these 130 schools is $11 million.
No matter how you do the budget accounting, it seems safe to conclude that for the majority of D1 schools, athletics is not a money-making activity. In that sense, D1 college sports is more like schools of music than the NBA or NFL.
In an upcoming post I'll take a look at the other end of the rankings where the numbers look distinctly different.
Wednesday, April 6, 2016
Meldonium: WADA, Science and Due Process

The tally of athletes who have tested positive for meldonium in 2016 continues to grow, now well over 100 athletes across multiple sports. None are more prominent than Maria Sharapova, whose announcement of a positive test last month sent shockwaves through the sporting world. The issues raised by the slew of positive tests offer an opportunity to improve anti-doping regulations and to further democratize sports governance.The argument is a preview of what I'll argue in greater depth in The Edge. Comments welcomed.
Tuesday, April 5, 2016
US Soccer MNT Elo Ratings by Coach 1990-2016

Source: Elo Ratings and the ratings explained.
Verbruggen Files an IOC Ethics Complaint Against WADA and USADA

The basis for Verbruggen's complaint is found here, and he highlights Pound's continued claims that he helped to cover up Lance Armstrong's doping as a motivation for his complaint. Verbruggen writes: "I would also like other people’s misdeeds to be judged objectively. It is for this reason that I have lodged a complaint against Pound, Howman, Tygart and Bock with the Ethics Commission of the IOC, a body that I trust to remain fully objective!"
However, the most serious charge appears to be this one against WADA and USADA:

Will this complaint go anywhere or have any significance? It is hard to tell, though the accusations levied by Verbruggen against WADA and USADA are pretty serious. We shall see what happens with the IOC..
Monday, April 4, 2016
How Much do State Universities Subsidize Athletics? Part 1 - Aggregate

The graph at the top of this post shows how subsidies for athletics changed from 2011 to 2014 as a proportion of total state higher educational revenues (black line). The total state higher educational revenues come from data collected by the State Higher Educational Officers Association (specifically, Table 3 in this PDF, note 2010 is extrapolated). The graph also shows how external funding of athletics across all of these 201 schools as a proportion of total state higher educational revenues.
The data shows that external funding of athletics in 2014 i\was about 4% of total state school educational revenue and the state subsidy was about 1.6%. Following the Chronicle, the "subsidy" is defined as the sum of institutional transfers to athletics plus student fees for athletics. If you add the two numbers together you'll get the total revenue for athletics. You can divide that by total state higher educational revenues across the 206 schools to get a sense of the comparative size of athletics of that total, which was about 5% in 2010 and about 5.6% in 2014.
Some additional data for 2014:
- Total educational revenue = $136.7 billion
- Total athletics spending = $7.5 billion
- Subsidy of athletics = $2.2 billion
- External funding of athletics = $5.5 billion
In a follow up post I will look at individual schools.
Saturday, April 2, 2016
How Much Do FBS Schools Spend on Coaches, Part 2?

The graph above shows how much three different schools spend on coaches: Ohio State, which tops the table, spends over $26 million. At the bottom of the 106-school table is the University of Louisiana-Monroe at $2.6 million, about 10% of that spent by OSU. Somewhere in the middle (#43) in my employer, the University of Colorado-Boulder at $12.6 million, just about half of OSU.
Let's compare these expenditures to total university budgets.

When we look at coaches salaries as a percentage of total campus budgets things get considerably more interesting.

What can we say about the total spending on coaches salaries across all 106 FBS schools?
A full accounting would require going into the budgets of each of the 106 schools, but we can do a quick back of the envelope calculation. The midpoint between OSU and ULM for total campus budgets is about $2.8 billion. Across 106 schools that suggests almost $300 billion in budgets. If you want a conservative lower bound we can cut that in half and use $150 billion.
The Knight Commission database tells us that the 106 schools collectively spend about $1.2 billion on coaches salaries - about the size of the total campus budget for the University of Colorado-Boulder.
So the total expenditure on coaches salaries across the 106 FBS schools, as a proportion of total university budgets, is $1.2 billion divided by $150 billion at the low end and $300 billion at the upper end. This is about 0.8% to 1.6% of total university spending or about 1% in a round number. Overall athletics spending across these programs is more like 5% of the total budgets.
Is 1% of university spending on coaches a lot? A little? Top line numbers like those at Ohio State capture most of the discussion, but the impact on the university may be far greater in places like Louisiana-Monroe.
This data does not answer questions at the heart of debates over college sports, but they should inform that discussion.
Friday, April 1, 2016
How Much Do FBS Schools Spend on Coaches?

The total expenditure is just about $1.2 billion, which is about the size of a a major research university like the University of Colorado, where I am a faculty member. In other words, the nation's top 106 athletic programs spend about 1 research university-worth of dollars on athletics coaches.
Here is a table of the top 50:
| 1 | THE OHIO STATE UNIVERSITY | $26,460,182 |
| 2 | THE UNIVERSITY OF TEXAS AT AUSTIN | $25,375,094 |
| 3 | THE UNIVERSITY OF ALABAMA | $23,159,068 |
| 4 | PENNSYLVANIA STATE UNIVERSITY | $22,746,542 |
| 5 | UNIVERSITY OF OKLAHOMA | $21,918,720 |
| 6 | UNIVERSITY OF MICHIGAN | $21,683,893 |
| 7 | LOUISIANA STATE UNIVERSITY AND AGRICULTURAL & MECHANICAL COLLEGE | $21,139,585 |
| 8 | UNIVERSITY OF LOUISVILLE | $20,884,261 |
| 9 | MICHIGAN STATE UNIVERSITY | $20,884,258 |
| 10 | AUBURN UNIVERSITY | $20,371,279 |
| 11 | UNIVERSITY OF KENTUCKY | $20,257,669 |
| 12 | UNIVERSITY OF FLORIDA | $20,206,975 |
| 13 | UNIVERSITY OF CALIFORNIA-LOS ANGELES | $18,764,600 |
| 14 | TEXAS A & M UNIVERSITY | $18,409,833 |
| 15 | UNIVERSITY OF SOUTH CAROLINA | $18,277,553 |
| 16 | UNIVERSITY OF VIRGINIA | $18,089,569 |
| 17 | UNIVERSITY OF IOWA | $17,404,934 |
| 18 | UNIVERSITY OF ARKANSAS | $17,137,702 |
| 19 | FLORIDA STATE UNIVERSITY | $17,020,714 |
| 20 | THE UNIVERSITY OF TENNESSEE | $16,933,891 |
| 21 | UNIVERSITY OF GEORGIA | $16,847,388 |
| 22 | UNIVERSITY OF WASHINGTON | $16,812,513 |
| 23 | ARIZONA STATE UNIVERSITY | $16,713,127 |
| 24 | UNIVERSITY OF OREGON | $16,283,951 |
| 25 | UNIVERSITY OF MISSOURI-COLUMBIA | $16,211,134 |
| 26 | UNIVERSITY OF CONNECTICUT | $16,197,062 |
| 27 | UNIVERSITY OF WISCONSIN-MADISON | $15,931,618 |
| 28 | UNIVERSITY OF NEBRASKA-LINCOLN | $15,589,712 |
| 29 | INDIANA UNIVERSITY-BLOOMINGTON | $15,569,609 |
| 30 | CLEMSON UNIVERSITY | $15,474,254 |
| 31 | OKLAHOMA STATE UNIVERSITY | $15,291,172 |
| 32 | UNIVERSITY OF ARIZONA | $15,267,187 |
| 33 | UNIVERSITY OF CALIFORNIA-BERKELEY | $14,669,054 |
| 34 | WEST VIRGINIA UNIVERSITY | $14,588,974 |
| 35 | NORTH CAROLINA STATE UNIVERSITY AT RALEIGH | $14,395,344 |
| 36 | UNIVERSITY OF MARYLAND-COLLEGE PARK | $14,162,812 |
| 37 | UNIVERSITY OF MISSISSIPPI | $13,729,892 |
| 38 | UNIVERSITY OF CINCINNATI | $13,707,453 |
| 39 | UNIVERSITY OF NORTH CAROLINA AT CHAPEL HILL | $13,642,676 |
| 40 | UNIVERSITY OF KANSAS | $13,359,816 |
| 41 | KANSAS STATE UNIVERSITY | $12,947,255 |
| 42 | VIRGINIA POLYTECHNIC INSTITUTE AND STATE UNIVERSITY | $12,765,778 |
| 43 | UNIVERSITY OF COLORADO BOULDER | $12,605,932 |
| 44 | PURDUE UNIVERSITY | $12,532,279 |
| 45 | UNIVERSITY OF MINNESOTA-TWIN CITIES | $12,137,176 |
| 46 | GEORGIA INSTITUTE OF TECHNOLOGY | $11,855,296 |
| 47 | MISSISSIPPI STATE UNIVERSITY | $11,825,452 |
| 48 | OREGON STATE UNIVERSITY | $11,776,500 |
| 49 | TEXAS TECH UNIVERSITY | $11,661,855 |
| 50 | IOWA STATE UNIVERSITY | $11,519,206 |
No April Fools: Can You Beat this Bracket?

She was asked about the source of her prognosticative ability:
“I am not really a sports person,” she said over the phone Thursday night.Meantime, my naive-bracket based on higher seeds is beating 75% of ESPN entries.
For instance, does she know anything about seedings? Syracuse at No. 10? “Nope.”
Can she name one player in the Final Four? “Uhhhh …. no. I know faces and stuff. I really don’t know much beyond that.”
She’s not a Final Four expert, then? “I didn’t know there were levels. I didn’t know there was best eight, or whatever. Or Final Four. I didn’t realize there was any of that. I thought they just kind of played basketball.”
For that matter, has she ever seen a basketball game in person in her life?
“I think I might have went to one in middle school, if that counts. Actually I have been to one in high school. The Globetrotters were there. I think that’s what they were called. And I worked the concession stand once, but I didn’t get to see any of the game because I was mostly handing out nachos.”
But she did fill out a bracket because it was for bonus points. “When he first handed the assignment out, I thought I’m not doing this, I don’t know what any of this means, maybe I’ll copy somebody’s."
Subscribe to:
Posts (Atom)